
WOP is an acronym for “Wealth Over People”. WOP curves are modified Distribution of Wealth curves. The vertical and horizontal scales each show percentages from one to one hundred. We imagine all the households in a nation being sorted from richest to poorest. They are then shrunk down and lined up (richest at the left) along the horizontal scale. For any particular household, its point on the curve represents how their wealth compares (as a %) to the average wealth of the richest (0th) percentile. For any nation, the average wealth of the richest 1/100 of households is the topmost point on the curve (People = 0%, Wealth = 100%) or (p=0, w=100) or (0,100).
In the real world two points on the wop curve are always known before any statistics are gathered. These are the topmost point (0,100) by definition, and the rightmost point (poorest people, lowest wealth) or (p=99,w=0) or (99,0). This unfortunate rightmost point is given because there is always at least one percent of households (incarcerated, long-term illness, etc) with no wealth at all. Given that the topmost and rightmost points are fixed… our interest lies in the form of the curve between them.
There are two extreme possible forms of the curve. The first is the “Perfect Communist” wop. It is a straight line from the leftmost (maximum wealth) point horizontally across the people scale to p=99, where it drops to wealth = 0. That is, almost all families have the same wealth.
The other extreme is the “Perfect Tyranny” form. It starts on the left at the Tyrant’s maximum wealth of 100%. It then immediately drops to zero and continues at zero across the rest of the people. That is, the tyrant and his friends (the top percentile) own all the nation’s wealth. All other citizens are serfs or slaves.
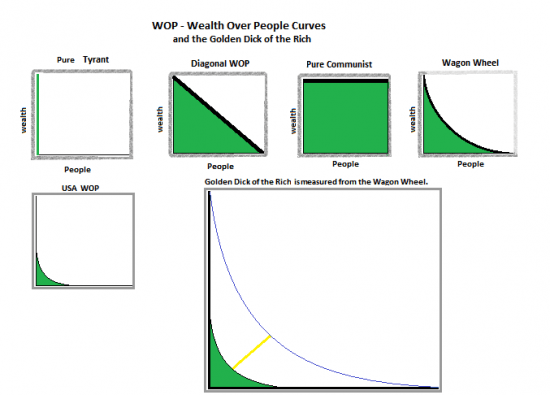
An obvious intermediate form is a straight line connecting the left/top point to the right/bottom point. In such a “Diagonal” society a household in the richest percentile would have just twice the wealth of a family in the median (50th) percentile. Such a society is compelling to many (especially the poor).
“Gini Values” (a decimal from 0 to 1) are used as a measure of the “disequity” in a particular economy. Gini values may apply to either income or wealth. A wealth Gini of zero correlates with a perfect communist WOP. A Gini of 1.0 correlates with the perfect tyranny WOP. In 2012 the United States had a wealth Gini of .801. Only Switzerland and Denmark had slightly more dis-equitable economies.
Whatever the form of a nation’s wop, there is always a “suction” on the curve from the graph origin. This suction tends to pull the curve towards the Pure Tyranny form. The three prime drivers of this suction are: 1) Takes money to make money. If you inherit millions tiz easy to make millions. 2) Whether or not private money is allowed to fund elections… politicians pushing low taxes on the rich and their corporations can and will be bought. 3) Money marries money.
It is apparent that the US wop is far advanced toward the “Pure Tyranny” form. Most US citizens are unaware of wop curves (or even of the concept of the Distribution of Wealth). This ignorance is much appreciated and encouraged by the aristocracy. But those of us who are aware of the increasing dis-equity (see graph at bottom) are distressed by it. However, many of us feel that a diagonal society would not offer the most deserving individuals a sufficient incentive or reward for extreme exertion, or extreme brilliance. The family of such a person would have only twice the wealth of the family of the “average Joe”. Our question then becomes, “Is there some other compelling form of the wop between the diagonal and the pure tyrant forms?”
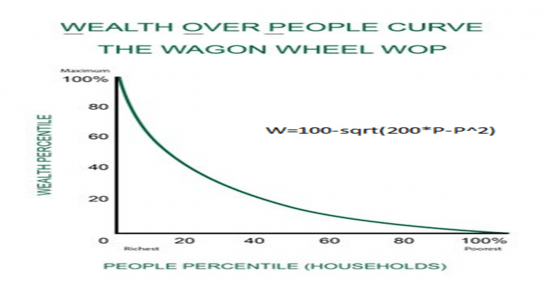
Yes! That intermediate form is the Wagon Wheel WOP. Imagine an old wagon wheel rolled up against the side of a barn. The quarter circle of the wheel between where it touches the ground and where it touches the barn constitute the wop curve that we desire. In such a society the richest one percent have a wealth (on average) that is six and a half times the wealth of the median family.
In theory, it would be a simple matter to change the USA’s wop from our current (nearly tyrannical) form into the wagon-wheel form. Wealth taxes would have to be imposed. If the objective was to move to the wagon wheel form in ten years, then (for each people percentile) the wealth tax would be adjusted so as to cause it to move to the desired point over that period. However, in a society where the aristocracy controls the political process; it is highly unlikely that any serious movement toward a more equitable sharing of wealth that could lead to the wagon-wheel effect. Click To Tweet
Post script: the more dis-equitable a nation is, the less likely it is to publish accurate wealth or income data for its top percentile. However nations are much more likely to publish accurate data for their average and median wealth. As it turns out, the median/average (Moa) can be used to find the exponent (Pwr) needed for the equation that gives the WOP curve for that nation. Anyone who can use a spreadsheet can then develop: 1) the WOP values & curve 2) Share of nation’s wealth held by the top percent 3) the wealth Gini value. Please see www.Greensuit.org for the needed equations.
This is a news share from OpED.com, the original article can be found by clicking HERE.

Joseph Mitchener
Latest posts by Joseph Mitchener (see all)
- Wealth Over People: Quantifying the Pernicious Effects of Capital Hoarders - February 28, 2019
